Reporting and Analytics
Last Update: 10-10-20231. Generating Reports
Navigate to the "Reports" Section
-- Open the Spread X application on your device.
-- Find and navigate to the "Reports" section, typically located in the main menu or dashboard.
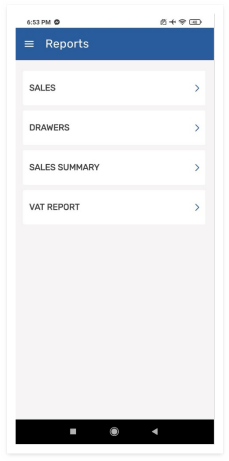
Explore Available Reports
-- Once in the "Reports" section, explore the various types of reports available. Common reports include sales reports, drawers/register reports, sales summary, and VAT reports.
2. Filter and Customize Reports:
Sales Report
-- Access the "Sales Report" to review detailed information on all transactions during a specified time period, such as Today, Weekly, Monthly, Yearly, or Custom.
-- Analyze sales trends, identify top-selling products, and evaluate the performance of different sales channels.
Drawers/Register Report
-- Explore the "Drawers/Register Report" to track the opening and closing balances of cash registers or drawers.
-- Gain insights into daily cash movements and discrepancies, ensuring accurate financial records.
Sales Summary
-- Utilize the "Sales Summary" report to obtain a high-level overview of your sales performance.
-- Summarize total sales, average transaction values, and other key metrics for quick business insights.
-- Review summarized information on all transactions during a specified time period, such as today, in a week, in a month, in 6 Months, or in a year.
VAT Report
-- Generate the "VAT Report" to ensure compliance with tax regulations.
-- Select date range to initiate generating VAT Report.
-- Review taxable sales, VAT amounts, and other relevant details for accurate tax reporting.